Web Mapping Technology
During my time at Avalara, I’ve learned a lot about interactive web maps. By “web maps”, I mean to include all the client and server tech needed to display a Google-map style map that a user can view in a browser. This document is to capture some of the concepts and tools I wish I knew when I started. This article includes commentary and opinions based on my own personal experiences. Wikipedia has a fine entry on tiled web maps. A very pro-Mapbox but well-written alternative to this document can be found here.
How Web Maps Work
Interactive tiled web maps, or “slippy maps”, share a certain UX. When a user drags the map with their mouse or finger, they expect that the map will “slip” under their mouse, as if an extremely large paper map was sliding around on a table. They expect to be able to zoom in and out, either by scrolling the mouse wheel or using the pinch gesture. Sometimes there are zoom controls to do the same thing.
How is the illusion of the infinitely large sliding map achieved?
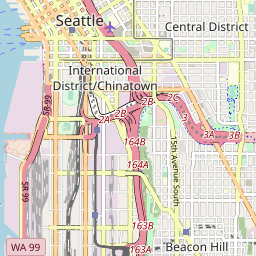
The map tile server has pre-rendered images of the entire mappable area, sliced up into 256 pixel squares called tiles.
Slippy map tile URLs follow a convention, namely zoom/x/y.
For example, the URL for a PNG tile at zoom level 13, column 1312 row 2861 looks like this /13/1312/2861.png.
As zoom levels increase, the number of tiles increases accordingly. At zoom level 2, the entire world is covered by 16 tiles. Covering the world at zoom level 12 would require 16.8 million tiles, and zoom level 19 requires 274.9 billion tiles. Although the vast majority of the world is ocean, this illustrates that one should not undertake the task of rendering and hosting tiles lightly.
Meanwhile, the map client needs the dimensions of the map container, a center coordinate and zoom level. Once initiated, the client downloads the specific tiles needed to completely cover the visible map area, places and clips them on the page. As the user drags the map around, the client moves the tiles accordingly and may download additional tiles as they come into view.
Raster map tiles are pre-rendered as PNG or JPG images, and it’s still the only way to effectively show satellite data. However, vector tiles are an attractive alternative for displaying the type of map we’re most accustomed to. Mapbox has taken the lead in championing vector tiles. As described in their vector tiles overview page:
Vector tiles contain vector data instead of the rendered image. They contain geometries and metadata – like road names, place names, house numbers – in a compact, structured format. Vector tiles are rendered only when requested by a client, like a web browser or a mobile app.
Besides rendering quickly and allowing custom styling, vector tiles are a practical way to interact with map features directly. For example, you could highlight certain features based on mouse interaction.
Client Libraries
There are a number client libraries for displaying interactive web maps.
OpenLayers
My personal favorite, OpenLayers is a web client library for displaying raster or vector maps. It’s free, mobile-ready, actively developed, and speedy (compared to Leaflet) because is uses Canvas and WebGL. If you’re building complicated interactivity such as an editor, you’ll find the built-in plugins and documentation top-notch.
var map = new ol.Map({
  target: "map",
  layers: [
    new ol.layer.Tile({
      source: new ol.source.OSM(),
    }),
  ],
  view: new ol.View({
    center: ol.proj.fromLonLat([37.41, 8.82]),
    zoom: 4,
  }),
});
Mapbox GL JS
As the inventor of vector tiles, Mapbox predictably has the best vector tile renderer. Webmaps rendered by Mapbox GL JS are gorgeous and butter-smooth. Since MVT is an open standard, this library can be used with other vector map tile providers, besides Mapbox. Their editing plugins are, as of this writing, an afterthought and a disappointment.
var map = new mapboxgl.Map({
  container: "map",
  style: "mapbox://styles/mapbox/streets-v10",
  center: [-74.5, 40],
  zoom: 9,
});
Google Maps JavaScript API
Once you sign up for a Google API key, you can have a Google map embedded in your page very quickly. But, this choice locks you into a Google-only ecosystem incompatible with the other client libraries and services.
var map = new google.maps.Map(document.getElementById("map"), {
  center: { lat: -34.397, lng: 150.644 },
  zoom: 8,
});
Apple MapKit JS
A relative newcommer to the web map space, Apple’s mapping library is proprietery just like Google’s. Their free usage tier is more generous than Google’s though.
d3-geo
The d3 data visualization library can absolutely be used to create a slippy map. If you already have d3 expertise or if you’re doing geographic data visualizations like choropleths, this is a good choice. The learning curve is steep though.
Others:
Map Tile Servers and APIs
You can host your own tiles with something like OpenMapTiles or TileStache. Since the XYZ URL format translates to static hosting well, it’s also possible to upload MBTiles to S3. One shouldn’t underestimate the complexity of keeping map data updated and available. There are a number of web services for hosting map tiles such as:
- Mapbox: Grade-A maps with excellent satellite layers, but can get pricey behind a paywall.
- MapTiler: A solid Mapbox competitor, but with lower quality satellite imagery.
- ArcGIS REST API: Free plan for non-revenue generating sites allows 1 million transactions/month.
- Google Maps: Expensive
- Here.com Map Tile API
These are just a few commercial services, there are many more. For example, here is an older community-curated list of map tile datasources.